Win
Tracing memory-leaks* under Windows
For a long time I am searching for a useable profiler for windows,
which does not only track the time (like VerySleepy) but memory-usage.
I was used to Instruments under OSX and – boy – I was surprised there
is nothing comparable under Windows.
Visual Studio newer than 2013 is not useable – I know there are profilers integrated.
Dr. Memory crashes at start.
AppVerifier does not work (crash).
http://wiki.qt.io/Profiling_and_Memory_Checking_Tools has some more
hints, but let me present the two tools which finally gave me some
insight:
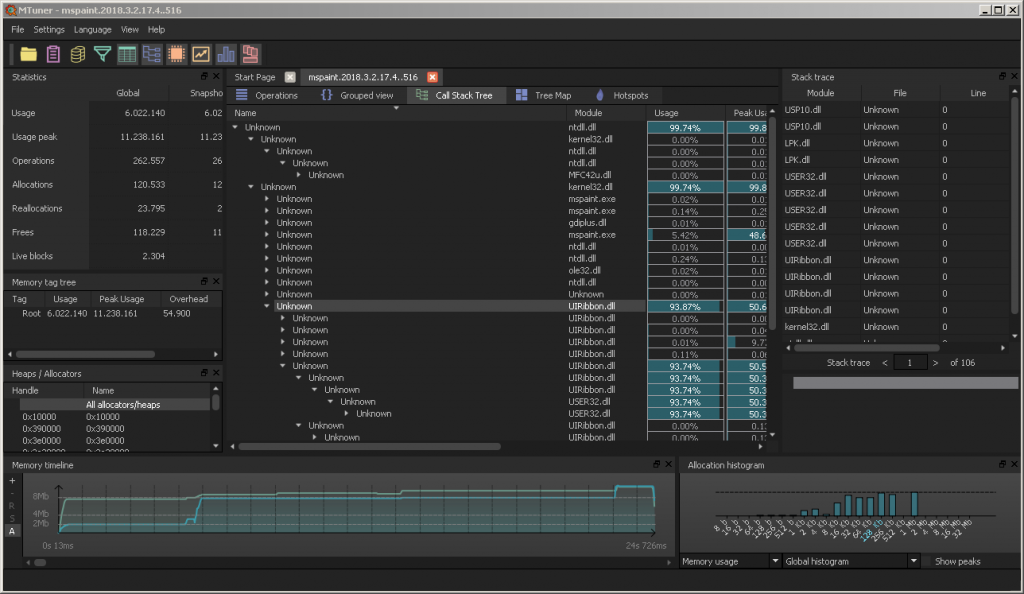
MTuner (https://github.com/milostosic/MTuner) from Milos Tosic (2017)

Pro: works out of the box without any reconfiguration of the app;
captures data which can be evaluated later; fancy looking; actively
maintained at github (answers error-reports fast); does not need much
explanation
Con: crashes currently while evaluating the bigger traces (400 MiByte+)
And then one Microsoft tool: UMDH
Con: much trouble to acquire and getting it to work (long explanation)
Pro: but the diff of the allocations as stacktraces can be helpful
0. install windows SDK
1. set the gflags correctly: means allow stacktraces for the process
2. capture two snapshots of current image of the process
C:\Program Files (x86)\Windows Kits\10\Debuggers\x86>umdh.exe -p:8480
-f:c:\alloc0.txt
and some moments/actions later
C:\Program Files (x86)\Windows Kits\10\Debuggers\x86>umdh.exe -p:8480
-f:c:\alloc1.txt
3. compare and get starting line 300-400 some descending view of the
biggest allocation-changes:
C:\Program Files (x86)\Windows Kits\10\Debuggers\x86>umdh.exe -d
c:\alloc0.txt c:\alloc1.txt > c:\alloc_diff10o1.txt
|
1 2 3 4 5 6 7 8 9 10 11 12 13 14 15 16 17 18 19 20 21 22 23 24 25 26 27 |
// Each log entry has the following syntax: // // + BYTES_DELTA (NEW_BYTES - OLD_BYTES) NEW_COUNT allocs BackTrace TRACEID // + COUNT_DELTA (NEW_COUNT - OLD_COUNT) BackTrace TRACEID allocations // ... stack trace ... // // where: // // BYTES_DELTA - increase in bytes between before and after log // NEW_BYTES - bytes in after log // OLD_BYTES - bytes in before log // COUNT_DELTA - increase in allocations between before and after log // NEW_COUNT - number of allocations in after log // OLD_COUNT - number of allocations in before log // TRACEID - decimal index of the stack trace in the trace database // (can be used to search for allocation instances in the original // UMDH logs). // + 66539182 ( 97482032 - 30942850) 1498137 allocs BackTrace181E60 + 954620 ( 1498137 - 543517) BackTrace181E60 allocations ntdll!RtlUlonglongByteSwap+BB9 MSVCR120!malloc+33 MSVCR120!operator new+E [...] |
at *: I know, sometimes it is not a leak, but “by design” 😉
“un-optimize” a VisualStudio-solution
By default after generating the solution from mpc-files for each vcxproj the optimization-level is set to maximum (O2), which can lead to trouble while debugging. Variables not “visible”, content of containers not readable, .. and then you can stop debugging, reset manually the optimization, restart and go to the breakpoint/crash. Which is a total waste of time.
I’ve also found no way to convince the mpc-buildsystem of building un-optimized.
Ok, then we build us a sed-oneliner which replaces in all project-files the line about optimization and run it under cygwin:
|
1 2 3 4 5 6 |
mpetrick@PC180301 /cygdrive/d/Repo $ time find . -name "*.vcxproj" -exec sed -i 's/<Optimization>MaxSpeed<\/Optimization>/<Optimization>Disabled<\/Optimization>/g' {} + real 0m2,240s user 0m0,247s sys 0m0,982s |
dumpDiver: analyze quickly Windows crash-dumps
I had the task to analyze a bigger collection of crashdumps. Loading the file everytime to VisualStudio, start debugging,
So, I thought if there are tools, which can extract the information (yes, the cdb for Windows) and put it to a file with the same name-prefix. Et voila: dumpDiver was born.
A small helper-batch-file which does the above-mentioned stuff. So that you can lean back and watch your computer grind at 100% workload 🙂
ps. Yes, I know, it is slightly wrong. dumpster-diver would be correct.
Need to fake some incoming packets?
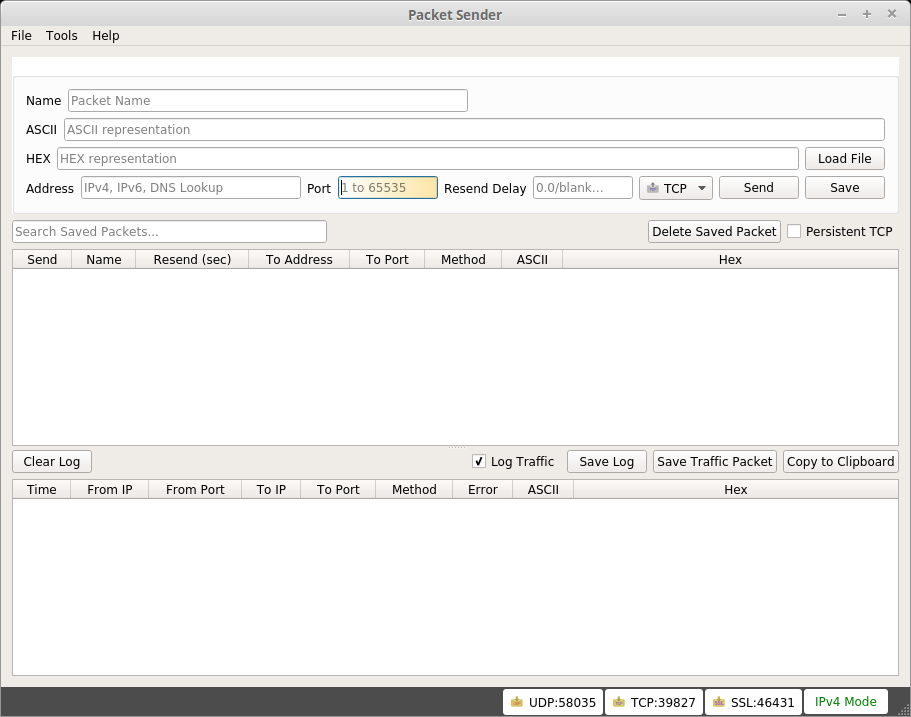
Try Packet Sender (available for all major OS: I used the portable version for Windows as well as the AppImage for Linux (I love that AppImage-idea. Already the third OSS which was packaged like this instead of a *.deb or as pure source ..)) to emulate the sending of some UDP-datagrams to test one of my programs. And it works really neatly.
You’ve got a tidy window with some textfields for receiver, type and content, a “fire away”-button, some repeat-ability. Nice!
On the receiving end we all know Wireshark. But the emulation was (at least to me) before some big black hole.
Yes, I know, there would be as well sendip. But at work I barely could make a Cygwin work. Not to speak about some dynamic “oh, I load more packages on the fly from the internet”-possibility, meh.
But for those interested: short tutorial for sendip.
proCreator: another helper for legacy Qt-projects
Ok, today at work I ran into the problem that for a Qt-project we have the code, the binaries and an awkward buildsystem (mpc). But I don’t want to process first the mpc and then fire up Visual Studio and wait for hours until the whole solution has been build. I want to use QtCreator! <3 So, there was never a real pro-file. The project consists of about ten classes, some forms and one ressource-file. Not much, possible to tinker it manually into a self-generated pro-file. Which can be processed then by QtCreator or qmake. (Hint "ls -X" is helpful for sorting by filetype.) But: why not delegate this to a small tool? First I thought about bash, then ... "maybe something better, like Python" ... and then ... why not Qt itself? So, please have a look at https://github.com/marcelpetrick/proCreator, which is half-way done. Outputting works. Just input-grabbing has to be implemented. Should be ready by sunday 🙂
Will keep you updated.
Speed up the Lotus Notes-start
Given the following (annoying) behavior: when you start Lotus Notes 8.5, you ALWAYS have to enter the password. There is no way around this. Research and discussion with colleagues showed that no one knows a way.
Idea: automate this!
(In detail what needs to be done: start Lotus Notes with the current parameters; wait until the logon-window appears; enter the password; press manually the Enter-Button in the input-mask, because just sending the Enter-key creates another issue).
So, I used the AutoIt-recorder (just in earlier versions available, so refer to this stack overflow-post how to download), recorded my user-actions (instead of specifying it myself command-by-command); compiled it to a x86-exe, and pinned a link to the Windows taskbar (as replacement for the Lotus Notes-starter).
Done 🙂
Win: check for which mode the executeable was built
Ok, in the past I used some more sophisticated tools to check the signature of the executables for Windows, but ..
Fire up notepad.exe; load the exe which shall be checked; search for “PE”.
If the visible characters depict a d(agger) and cross (“d†”), then x64 (more correct: x86_64).
Else if a big L (“L”), then x86.
Automate the boring stuff ..
.. with Python: that’s the title of an interesting book.
But I used (again) AutoIt to automate the task to enter every day my working hours via the company’s choice “SAP-portal”. Which is slow. Really, really slow. Delays of 6 seconds for requesting a certain tab via browser are not uncommon.
Code is available via: https://github.com/marcelpetrick/SAP_AutoIt
The most interesting part for me was to play around with the “image search”-capability of AuoIt. Looks like someone added this feature from AuotHotkey as custom DLL. You can let your script check a certain screen-area for a specific bitmap and if found, then move the cursor there. It helps to make the scripts more “smart” and independent from fixed screen-coordinates. I have some other uses in mind, but time will show 😉
I know that the current state of the code is quite ‘spaghetti’, but … first a solution, then refine. Also the way how to define the input-data has to be improved.
Prepare an SD-card for Raspberry Pi (3)
Download latest Raspbian-image:
* https://downloads.raspberrypi.org/raspbian_latest
Install etcher:
* add “deb https://dl.bintray.com/resin-io/debian stable etcher” to /etc/apt/sources.list
* “sudo apt-key adv –keyserver hkp://pgp.mit.edu:80 –recv-keys 379CE192D401AB61”
* “sudo apt update && sudo apt install etcher-electron”
Use etcher .. (I think this step is self-explanatory).
20190807: etcher for Win (10): https://github.com/balena-io/etcher/releases/ – also as portable version
clean my code: reloaded!
As always: some projects need a first (working) implementation and then over time you can improve them.
During lunch I was talking with a colleague about this tool. Then the idea to just use those actually changed files from the current implementation (means: the current branch in Git) shall be used as input. Et voila: consider it done!
Also added some fine-tuning to the call-parameter of the script itself, so it can be run as well with some custom string beside “todoM” (which is my marker).
Cleaning an implementation of properly tagged lines takes now a second – not minutes (like before!
Enjoy and have fun 🙂
Code can be found as always at https://github.com/marcelpetrick/cleanMyCode/blob/master/remove_todoM.sh
