For a long time I am searching for a useable profiler for windows,
which does not only track the time (like VerySleepy) but memory-usage.
I was used to Instruments under OSX and – boy – I was surprised there
is nothing comparable under Windows.
Visual Studio newer than 2013 is not useable – I know there are profilers integrated.
Dr. Memory crashes at start.
AppVerifier does not work (crash).
http://wiki.qt.io/Profiling_and_Memory_Checking_Tools has some more
hints, but let me present the two tools which finally gave me some
insight:
MTuner (https://github.com/milostosic/MTuner) from Milos Tosic (2017)
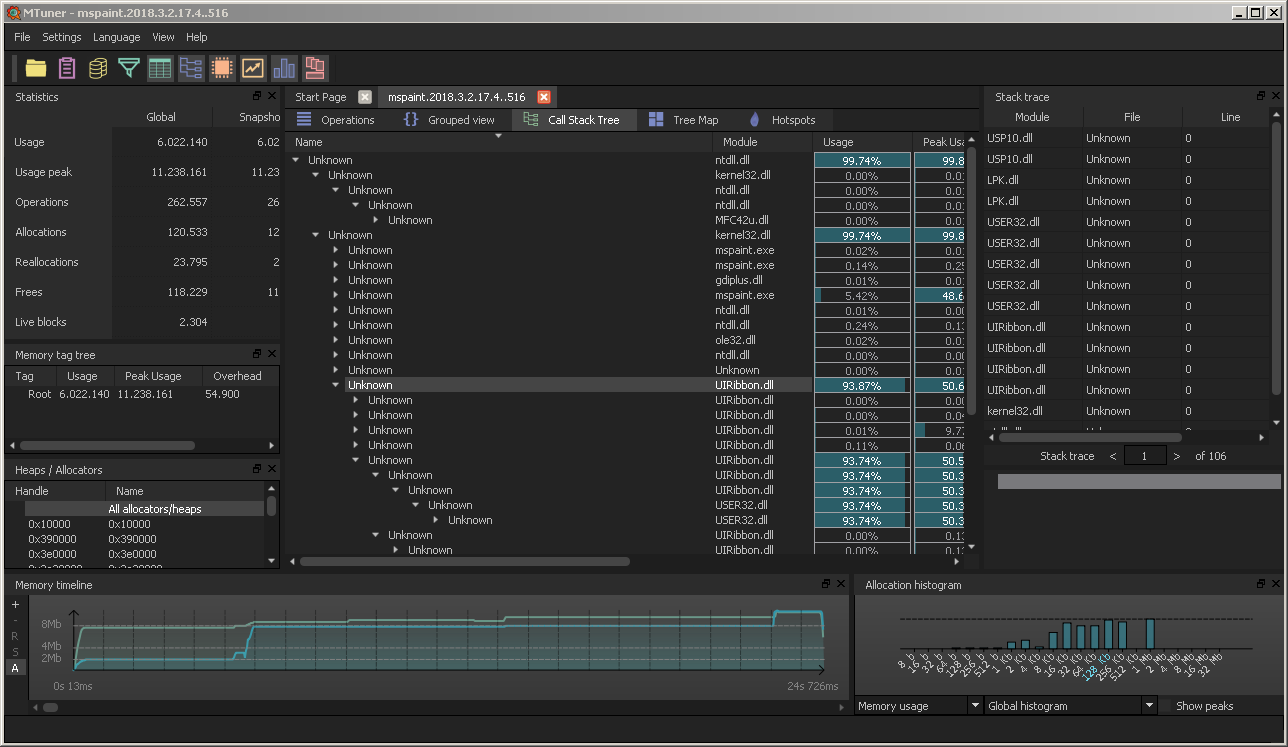
Pro: works out of the box without any reconfiguration of the app;
captures data which can be evaluated later; fancy looking; actively
maintained at github (answers error-reports fast); does not need much
explanation
Con: crashes currently while evaluating the bigger traces (400 MiByte+)
And then one Microsoft tool: UMDH
Con: much trouble to acquire and getting it to work (long explanation)
Pro: but the diff of the allocations as stacktraces can be helpful
0. install windows SDK
1. set the gflags correctly: means allow stacktraces for the process
2. capture two snapshots of current image of the process
C:\Program Files (x86)\Windows Kits\10\Debuggers\x86>umdh.exe -p:8480
-f:c:\alloc0.txt
and some moments/actions later
C:\Program Files (x86)\Windows Kits\10\Debuggers\x86>umdh.exe -p:8480
-f:c:\alloc1.txt
3. compare and get starting line 300-400 some descending view of the
biggest allocation-changes:
C:\Program Files (x86)\Windows Kits\10\Debuggers\x86>umdh.exe -d
c:\alloc0.txt c:\alloc1.txt > c:\alloc_diff10o1.txt
|
1 2 3 4 5 6 7 8 9 10 11 12 13 14 15 16 17 18 19 20 21 22 23 24 25 26 27 |
// Each log entry has the following syntax: // // + BYTES_DELTA (NEW_BYTES - OLD_BYTES) NEW_COUNT allocs BackTrace TRACEID // + COUNT_DELTA (NEW_COUNT - OLD_COUNT) BackTrace TRACEID allocations // ... stack trace ... // // where: // // BYTES_DELTA - increase in bytes between before and after log // NEW_BYTES - bytes in after log // OLD_BYTES - bytes in before log // COUNT_DELTA - increase in allocations between before and after log // NEW_COUNT - number of allocations in after log // OLD_COUNT - number of allocations in before log // TRACEID - decimal index of the stack trace in the trace database // (can be used to search for allocation instances in the original // UMDH logs). // + 66539182 ( 97482032 - 30942850) 1498137 allocs BackTrace181E60 + 954620 ( 1498137 - 543517) BackTrace181E60 allocations ntdll!RtlUlonglongByteSwap+BB9 MSVCR120!malloc+33 MSVCR120!operator new+E [...] |
at *: I know, sometimes it is not a leak, but “by design” 😉
Leave a Reply
You must be logged in to post a comment.