VisualStudio
Visual Studio 2015: error LINK1158 rc.exe not found
Challenge: Visual Studio 2015, Windows Kit 8 and 10 installed, test application (as solution) for a SDK not buildable
Solution:
copy rc.exe and rcdll.dll from
C:\Program Files (x86)\Windows Kits\8.1\bin\x64
to
C:\Program Files (x86)\Microsoft Visual Studio 14.0\VC\bin
Visual Studio testrunner still running … and stopping you from accessing DLLs for linking
Problem Challenge:
Several instances of vstest.executionengine.clr20.exe are still running, despite closing that nice Visual Studio 2015 and therefore the access to compile and link several DLLs with QtCreator is blocked.
Closing them one by one with the taskmanager is annoying.
Solution:
* CMD as admin
* $ taskkill /IM vstest.executionengine.clr20.exe /T /F
* or: $ wmic process where name=’vstest.executionengine.clr20.exe’ delete
Win: run script after executing the VisualStudio-environment-command
Problem: our CMakeLists.txt contained one specific variable which is just set via the VisualStudio-command-prompt. But I did not want to start that cmd, then execute our “start IDE”-script from there. Naa, too much clicks 😉
Copy this as bat-file to the directory where the qtcreator.bat would be.
|
1 2 3 4 5 6 7 8 9 10 11 12 13 14 |
@echo off rem inspiration from https://www.codeproject.com/Questions/541856/Batchplusfile-3aplusOpenpluscmd-2cplusrunplusVSplu set workingDir=C:\Program Files (x86)\Microsoft Visual Studio\2017\BuildTools\Common7\Tools\ set vs=VsDevCmd.bat rem execute the VS build enviroment cd %workingDir% call %vs% rem go back to current directory cd /d %~dp0 qtcreator.bat |
Enable Profiling on Windows even with Meltdown-patches
|
1 2 |
reg add "HKEY_LOCAL_MACHINE\SYSTEM\CurrentControlSet\Control\Session Manager\Memory Management" /v FeatureSettingsOverride /t REG_DWORD /d 3 /f reg add "HKEY_LOCAL_MACHINE\SYSTEM\CurrentControlSet\Control\Session Manager\Memory Management" /v FeatureSettingsOverrideMask /t REG_DWORD /d 3 /f |
Helped with Visual Studio 2015. Should also work for 2013 and 2017.
Cppdepend: measure defects (code smells), cyclomatic complexity …
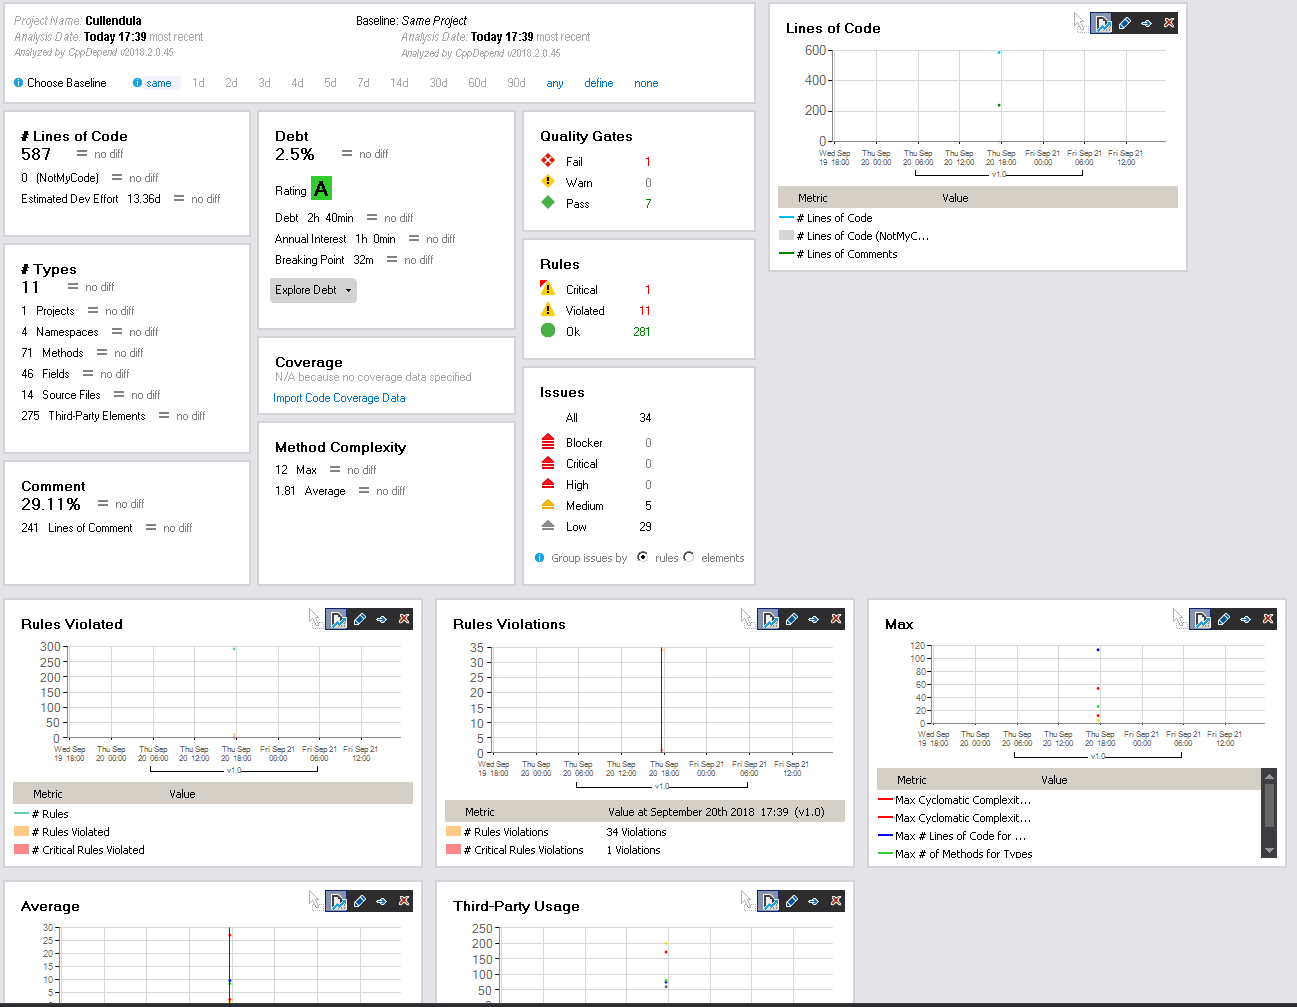
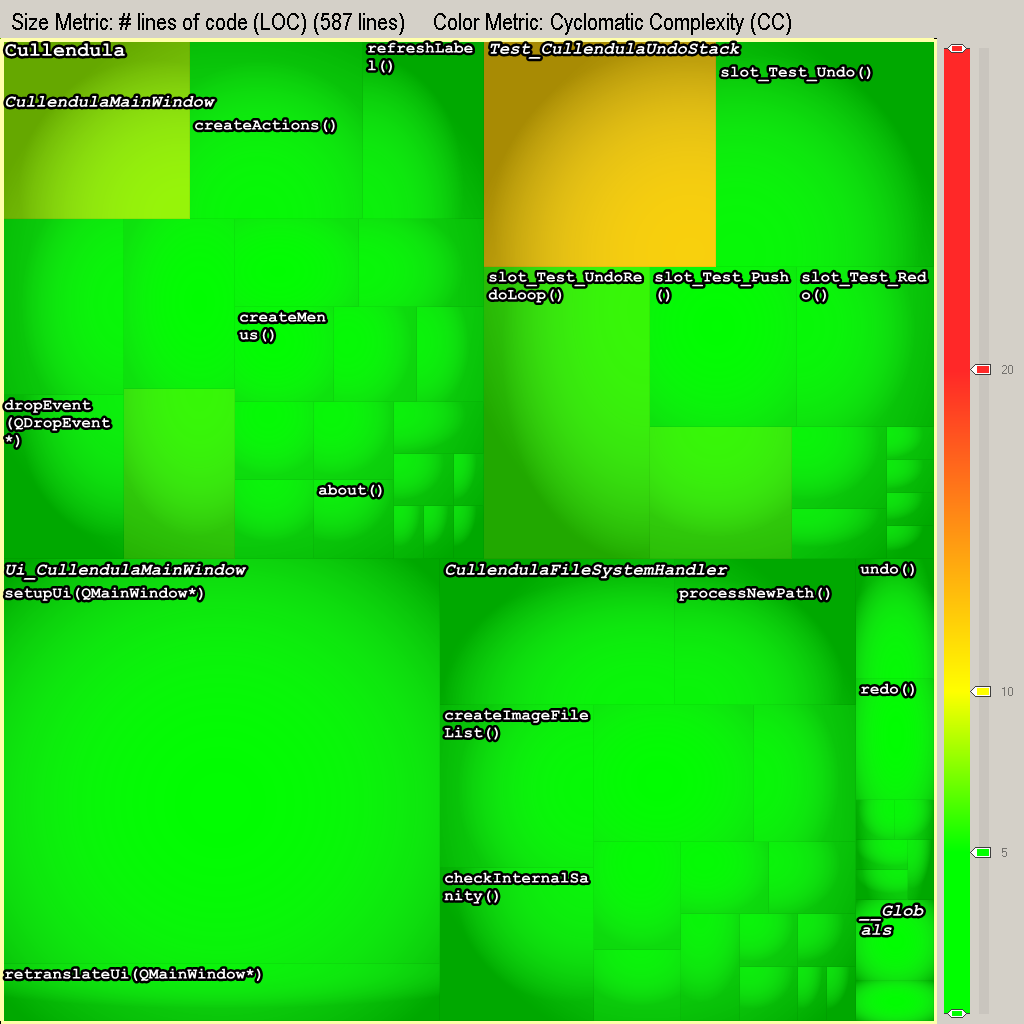
As every one knows: I am a fan of objective measurements in the quality and quantity of code. Another nice statistics-generator for such a task is: cppdepend (trial is free for the first month).
It can detect some mistakes and deviations from common coding guidelines (like MISRA) and supports your judgment with some figures.
Cullendula for instance has the estimated development effort of 13 days (right now, v0.4.1) and a technical debt-rating of A. Which is great! 🙂
MPC: adding additional DEFINES
Some weeks ago I noticed how the qDebug()-output could be enriched, so that in bigger solutions with a lot of different “unknown” components a reported error could be immediately pinned. And you save writing always __FILE__ and __LINE__. Referres to this post.
But the problem was that with the mpc-buildsystem it was unknown to me how to force it to put this DEFINE into the vcxproj-files.
It can be done via the “macros”-statement!
So I worked on my Python-skills and wrote a short script which iterates the given path recursively and fixes all mpc-files by checking for the position of the line with the last closingbrace “}” and then it adds before that position the line. Of course, the experts know several thousand ways to improve that script – but I am currently happy with it. It works, it is debug-able (.sh, I look at you!) and I will use the skeleton also for some other tasks.
It can be found (like most Python-snippets) at: https://github.com/marcelpetrick/pythonCollection
|
1 2 3 4 5 6 7 8 9 10 11 12 13 14 15 16 17 18 19 20 21 22 23 24 25 26 27 28 29 30 31 32 33 34 35 36 37 38 39 40 41 42 43 44 45 46 47 48 49 50 51 52 53 54 55 56 57 58 59 60 61 62 63 |
import fileinput import sys import os #------------------------------------------ def addMacroToFile(filename, newStatement): #print("called addMacroToFile:", filename, determinePositionOfLastBrace(filename)) returnValue = "fail" posLastBrace = determinePositionOfLastBrace(filename) posCurrentLine = 1 for line in fileinput.input(filename, inplace=True): # add additional line in case of matching last brace if posCurrentLine == posLastBrace: sys.stdout.write(newStatement) sys.stdout.write("\n") # newline, else it would be put just before the brace returnValue = "success" sys.stdout.write(line) # prints without additional newline (on windows) posCurrentLine += 1 return returnValue #------------------------------------------ # return the position of the last brace. # possible improvement: in case of some malformed mpc: skip .. def determinePositionOfLastBrace(filename): lastPos = -1 position = 1 with open(filename, "r") as file: #has implicit close - which is nice for line in file: if line.__contains__("}"): lastPos = position position += 1 return lastPos # ------------------------------------------ # find all mpb/mpc files def fixAllFilesRecursively(path, suffix, newStatement): for dirname, dirnames, filenames in os.walk(path): for filename in filenames: full_path = os.path.join(dirname, filename) if full_path.endswith(suffix): print(full_path) wasSuccessful = addMacroToFile(full_path, newStatement) if wasSuccessful == "success": print(" modified :)") # prevent recursion into those subdirs with meta-data if '.svn' in dirnames: dirnames.remove('.svn') if '.git' in dirnames: dirnames.remove('.git') #------------------------------------------ #------------------------------------------ path = "D:\Repo_INS_RADARNX" suffix = "mpc" newStatement = " macros += QT_MESSAGELOGCONTEXT" # TODO possible improvement: prevent double application of the added macro .. fixAllFilesRecursively(path, suffix, newStatement) |
Preventing the crash of the performance-profiler from Visual Studio (2013-2017) due to Meltdown-/Spectre-patches
I needed some analytical help from Visual Studio (due to the fact that MTuner and AQTimer could not work properly with our suite). So, I build my solution, fire up the “Performance Profiling” in VS2015 and *zump* computer reboots.
Discussions and investigations led to the thesis that some Windows-patches are the culprit, because they prevent that previously used hooks are usable.
So, setting those two lines in an admin-enabled cmd.exe (plus reboot) lead to alleviation:
|
1 2 |
reg add "HKEY_LOCAL_MACHINE\SYSTEM\CurrentControlSet\Control\Session Manager\Memory Management" /v FeatureSettingsOverride /t REG_DWORD /d 3 /f reg add "HKEY_LOCAL_MACHINE\SYSTEM\CurrentControlSet\Control\Session Manager\Memory Management" /v FeatureSettingsOverrideMask /t REG_DWORD /d 3 /f |
static code analysis: PVS Studio
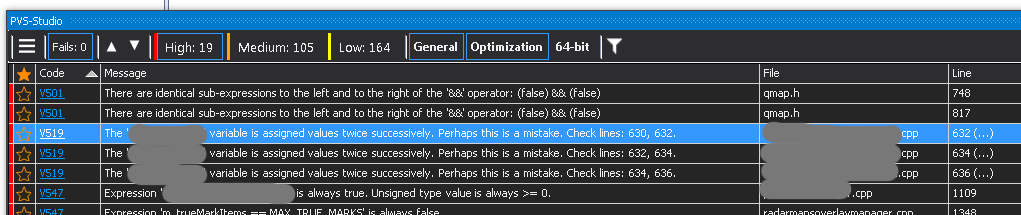
I am using a new static code analysis-tool for some weeks now and it turns out quite handy: PVS Studio.
It integrates quite well into Visual Studio and you can run the analysis of projects or the whole solution. Doing this can take a while, because all includes are analyzed as well – which is nice. For a single developer a trial-license is for evaluation enough – if you can refrain from the really nice “jump to the culprit”-functionality.
It looks like it detects more errors than cppcheck (another tool which I use now for years on several platforms) and without doubt: none of the reported lines were false positives!
Of course, there is always the discussion with colleagues if those tools help. But I will repeat it again: why not buy & apply them and get a lot of troubleshooting for zero investment of creativity and time!
The screenshot hints out (for instance) that some breaks are missing in the switch-case – and yes, the resulting symptoms were already reported as bug in JIRA.
QT_MESSAGELOGCONTEXT: more detailed qDebug()
Add to your environment:
|
1 |
QT_MESSAGE_PATTERN="(%{file} : %{line}) :: %{message}" |
Windows: set either via “set” or via RapidEnvironmentEditor.
In case of a no-debug-build, add QT_MESSAGELOGCONTEXT to DEFINES in the pro-file.
(Open question: if there are just mpc/vcxproj-files, then how to trigger?)
related sources:
* https://woboq.com/blog/nice-debug-output-with-qt.html
* https://fecub.wordpress.com/2015/11/04/better-debug-output-using-qt_message_pattern/
* http://doc.qt.io/qt-5/qmessagelogcontext.html#details
Convert *.pro to *.vcxproj (qmake to Visual Studio-project)
0. Change this particualar line inside the *.pro:
|
1 2 3 |
# app is working for build and processing with qtcreator, vcapp is for visual studio #TEMPLATE = app TEMPLATE = vcapp |
1. run qmake against that pro-file
2. load the vcxproj with Visual Studio
edit: or do it with the original pro-file just like the wiki.qt.io suggests:
|
1 |
qmake -tp vc test.pro |