Tracing memory-leaks* under Windows
For a long time I am searching for a useable profiler for windows,
which does not only track the time (like VerySleepy) but memory-usage.
I was used to Instruments under OSX and – boy – I was surprised there
is nothing comparable under Windows.
Visual Studio newer than 2013 is not useable – I know there are profilers integrated.
Dr. Memory crashes at start.
AppVerifier does not work (crash).
http://wiki.qt.io/Profiling_and_Memory_Checking_Tools has some more
hints, but let me present the two tools which finally gave me some
insight:
MTuner (https://github.com/milostosic/MTuner) from Milos Tosic (2017)
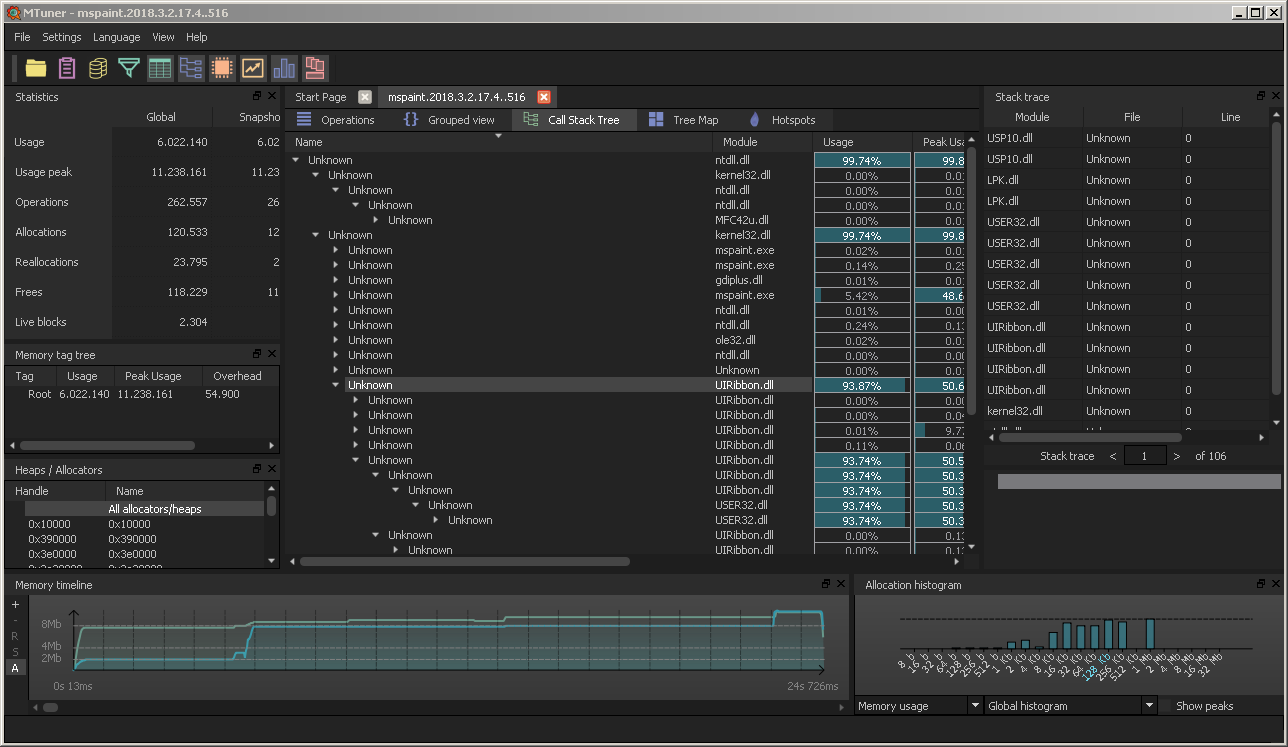
Pro: works out of the box without any reconfiguration of the app;
captures data which can be evaluated later; fancy looking; actively
maintained at github (answers error-reports fast); does not need much
explanation
Con: crashes currently while evaluating the bigger traces (400 MiByte+)
And then one Microsoft tool: UMDH
Con: much trouble to acquire and getting it to work (long explanation)
Pro: but the diff of the allocations as stacktraces can be helpful
0. install windows SDK
1. set the gflags correctly: means allow stacktraces for the process
2. capture two snapshots of current image of the process
C:\Program Files (x86)\Windows Kits\10\Debuggers\x86>umdh.exe -p:8480
-f:c:\alloc0.txt
and some moments/actions later
C:\Program Files (x86)\Windows Kits\10\Debuggers\x86>umdh.exe -p:8480
-f:c:\alloc1.txt
3. compare and get starting line 300-400 some descending view of the
biggest allocation-changes:
C:\Program Files (x86)\Windows Kits\10\Debuggers\x86>umdh.exe -d
c:\alloc0.txt c:\alloc1.txt > c:\alloc_diff10o1.txt
|
1 2 3 4 5 6 7 8 9 10 11 12 13 14 15 16 17 18 19 20 21 22 23 24 25 26 27 |
// Each log entry has the following syntax: // // + BYTES_DELTA (NEW_BYTES - OLD_BYTES) NEW_COUNT allocs BackTrace TRACEID // + COUNT_DELTA (NEW_COUNT - OLD_COUNT) BackTrace TRACEID allocations // ... stack trace ... // // where: // // BYTES_DELTA - increase in bytes between before and after log // NEW_BYTES - bytes in after log // OLD_BYTES - bytes in before log // COUNT_DELTA - increase in allocations between before and after log // NEW_COUNT - number of allocations in after log // OLD_COUNT - number of allocations in before log // TRACEID - decimal index of the stack trace in the trace database // (can be used to search for allocation instances in the original // UMDH logs). // + 66539182 ( 97482032 - 30942850) 1498137 allocs BackTrace181E60 + 954620 ( 1498137 - 543517) BackTrace181E60 allocations ntdll!RtlUlonglongByteSwap+BB9 MSVCR120!malloc+33 MSVCR120!operator new+E [...] |
at *: I know, sometimes it is not a leak, but “by design” 😉
“un-optimize” a VisualStudio-solution
By default after generating the solution from mpc-files for each vcxproj the optimization-level is set to maximum (O2), which can lead to trouble while debugging. Variables not “visible”, content of containers not readable, .. and then you can stop debugging, reset manually the optimization, restart and go to the breakpoint/crash. Which is a total waste of time.
I’ve also found no way to convince the mpc-buildsystem of building un-optimized.
Ok, then we build us a sed-oneliner which replaces in all project-files the line about optimization and run it under cygwin:
|
1 2 3 4 5 6 |
mpetrick@PC180301 /cygdrive/d/Repo $ time find . -name "*.vcxproj" -exec sed -i 's/<Optimization>MaxSpeed<\/Optimization>/<Optimization>Disabled<\/Optimization>/g' {} + real 0m2,240s user 0m0,247s sys 0m0,982s |
backup your Raspberry Pi-sd card
|
1 2 3 4 5 6 7 8 9 10 11 12 13 14 15 16 17 18 19 20 |
tanteedith@miniPC ~/ $ lsblk NAME MAJ:MIN RM SIZE RO TYPE MOUNTPOINT sdb 8:16 1 29G 0 disk ├─sdb2 8:18 1 1K 0 part ├─sdb7 8:23 1 27,3G 0 part /media/tanteedith/root ├─sdb5 8:21 1 32M 0 part /media/tanteedith/SETTINGS ├─sdb1 8:17 1 1,1G 0 part ├─sdb8 8:24 1 512M 0 part /media/tanteedith/data └─sdb6 8:22 1 66M 0 part /media/tanteedith/boot sda 8:0 0 119,2G 0 disk ├─sda2 8:2 0 7,7G 0 part [SWAP] ├─sda3 8:3 0 81,1G 0 part /home └─sda1 8:1 0 30,5G 0 part / tanteedith@miniPC ~/ $ sudo dd bs=4M if=/dev/sdb of=catcam.img 7416+0 records in 7416+0 records out 31104958464 bytes (31 GB) copied, 2794,33 s, 11,1 MB/s tanteedith@miniPC ~/ $ |
Newer versions (8.24+) of coreutils dd have also a progress-option, but not the one bundled with the current distribution ..
add param: “status=progress”
Learning how to solder – a hot iron
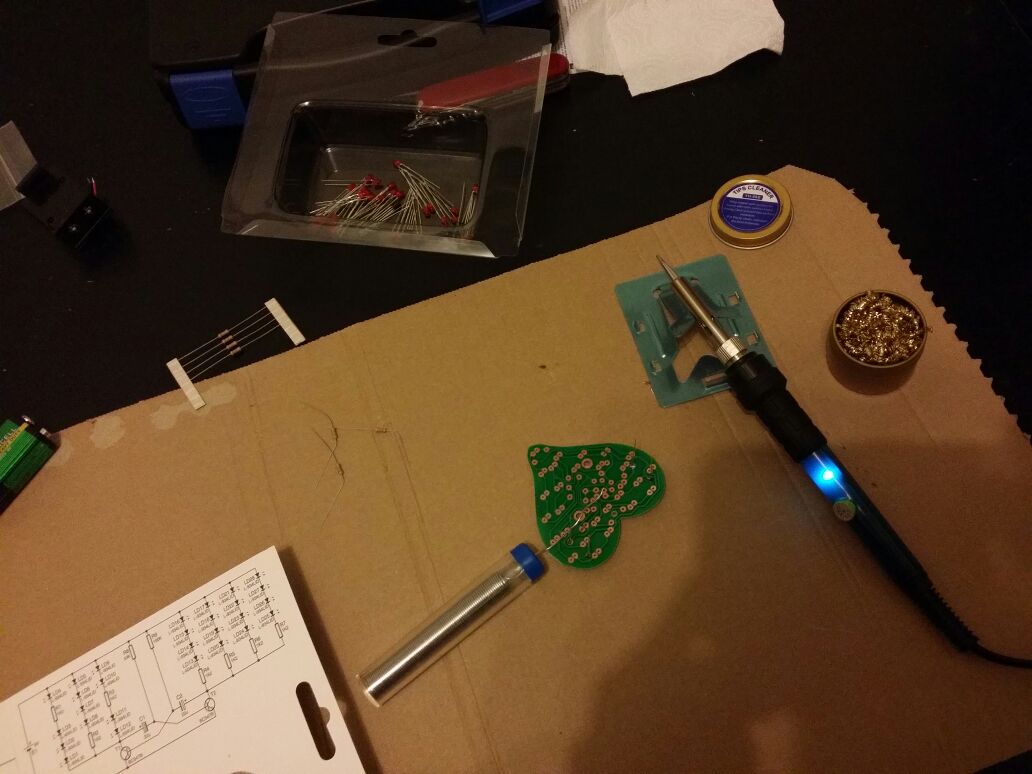
Bought myself a soldering iron and a small kit for practising purposes: 28 led, 9 resistors, 2 capacitors and 2 transistors waited to be soldered. And hey, the result is more than I had hoped for :’) It’s never too late to learn new skills! #growyourownhappiness
This is/was part of my 2018-campaign to acquire more experiences with discrete electronics. Software is nice, but we need something which moves and blinks (to impress people).

dumpDiver: analyze quickly Windows crash-dumps
I had the task to analyze a bigger collection of crashdumps. Loading the file everytime to VisualStudio, start debugging,
So, I thought if there are tools, which can extract the information (yes, the cdb for Windows) and put it to a file with the same name-prefix. Et voila: dumpDiver was born.
A small helper-batch-file which does the above-mentioned stuff. So that you can lean back and watch your computer grind at 100% workload 🙂
ps. Yes, I know, it is slightly wrong. dumpster-diver would be correct.
banner generator: figlet (online)
Ok, most of the times your classes and functions shall be commented.
So, let us decorate a bit: your wish shall be my command 😉
I had just remembered the good old toolkit to generate banners!
url: http://patorjk.com/software/taag/
|
1 2 3 4 5 6 7 8 9 10 11 |
// // 88888888ba 88 // 88 "8b ,d ,d 88 // 88 ,8P 88 88 88 // 88aaaaaa8P' ,adPPYba, ,adPPYba, MM88MMM ,adPPYba, ,adPPYba, 88,dPYba,,adPYba, 88,dPYba,,adPYba, ,adPPYba, 8b,dPPYba, MM88MMM ,adPPYba, 8b d8 ,adPPYba, 8b,dPPYba, 88 // 88""""""8b, a8P_____88 I8[ "" 88 a8" "" a8" "8a 88P' "88" "8a 88P' "88" "8a a8P_____88 88P' `"8a 88 a8P_____88 `8b d8' a8P_____88 88P' "Y8 88 // 88 `8b 8PP""""""" `"Y8ba, 88 8b 8b d8 88 88 88 88 88 88 8PP""""""" 88 88 88 8PP""""""" `8b d8' 8PP""""""" 88 "" // 88 a8P "8b, ,aa aa ]8I 88, "8a, ,aa "8a, ,a8" 88 88 88 88 88 88 "8b, ,aa 88 88 88, "8b, ,aa `8b,d8' "8b, ,aa 88 aa // 88888888P" `"Ybbd8"' `"YbbdP"' "Y888 `"Ybbd8"' `"YbbdP"' 88 88 88 88 88 88 `"Ybbd8"' 88 88 "Y888 `"Ybbd8"' "8" `"Ybbd8"' 88 88 // // |
20 min-project of today: creepy squirrel

Had in mind to play around with the “make LED shine directly via PIN”-feature of the Calliope Mini. Worked, nice 🙂
Actually for both “eyes” it is randomnly picked if they shall light up (and down) separately, but the GIF can can last just 3 seconds.
|
1 2 3 4 5 6 7 8 9 10 11 12 13 14 15 16 17 18 19 20 21 22 23 24 25 26 27 |
let ledpowerinverted = 0 let pin2 = false let pin1 = false basic.forever(() => { pin1 = Math.randomBoolean() pin2 = Math.randomBoolean() for (let ledpower = 0; ledpower <= 1023; ledpower++) { if (pin1) { pins.analogWritePin(AnalogPin.P1, ledpower) } if (pin2) { pins.analogWritePin(AnalogPin.P2, ledpower) } basic.pause(2) } for (let ledpower2 = 0; ledpower2 <= 1023; ledpower2++) { ledpowerinverted = 1023 - ledpower2 if (pin1) { pins.analogWritePin(AnalogPin.P1, ledpowerinverted) } if (pin2) { pins.analogWritePin(AnalogPin.P2, ledpowerinverted) } basic.pause(2) } basic.pause(500) }) |
I need a new mp3-player: why not buy again a (used) Sansa Clip+ and Rockbox it?
Guide is still valid.
Downloading the firmware-binary and running the Rockbox-installer (now at version 3.14) under Linux was not a problem.
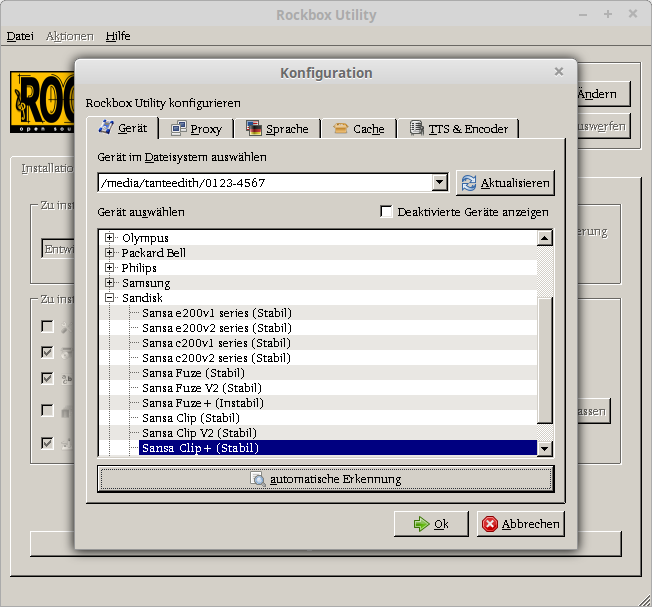
Five minutes later I got a “new” working player. Still prefer it to the (smart-)phone while doing fitness.
applied science ;3
The surface-temperature of an average ~furry lazybutt~ housecat is 24°C 😀
For this important experiment you need: a Calliope Mini, a computer science-degree and too much free time ;’)
Just kidding, the code is quite simple:
|
1 2 3 4 |
input.onButtonPressed(Button.A, () => { music.playTone(262, music.beat(BeatFraction.Whole)) basic.showString("" + input.temperature() + "°C") }) |
proper rename-scheme for digiKam
The Olympus-cam has no nice way to set an immediate scheme for the filename, so I transfer the files to the PC and fire up digiKam:
|
1 |
[date:yyyyMMdd-hhmmss]{unique:3} |
Fun fact: since it is based on KDE –> Qt, it also uses the same formatting for DateTime like Qt. Horay 🙂
Addendum: to fix the annoying “no klauncher found”-message and the invisible thumbnails after some certain apt-get-upgrades, just run
|
1 |
sudo apt-fast install kde-runtime |
again.