VisualStudio
VS2015: after start the solution-explorer just shows error-messages ..
Error message:
Exception details:
System.ComponentModel.Composition.ImportCardinalityMismatchException: No exports were found that match the constraint:
ContractName
Delete that folder:
%LocalAppData%\Microsoft\VisualStudio\12.0\ComponentModelCache
Found via SO..
VisualStudio-Addin for Qt
The source for the current downloads: https://download.qt.io/official_releases/vsaddin/ (for MSVC 2013, 2015 and 2017), because I had to (again) search for the installation-files.
Tracing memory-leaks* under Windows
For a long time I am searching for a useable profiler for windows,
which does not only track the time (like VerySleepy) but memory-usage.
I was used to Instruments under OSX and – boy – I was surprised there
is nothing comparable under Windows.
Visual Studio newer than 2013 is not useable – I know there are profilers integrated.
Dr. Memory crashes at start.
AppVerifier does not work (crash).
http://wiki.qt.io/Profiling_and_Memory_Checking_Tools has some more
hints, but let me present the two tools which finally gave me some
insight:
MTuner (https://github.com/milostosic/MTuner) from Milos Tosic (2017)
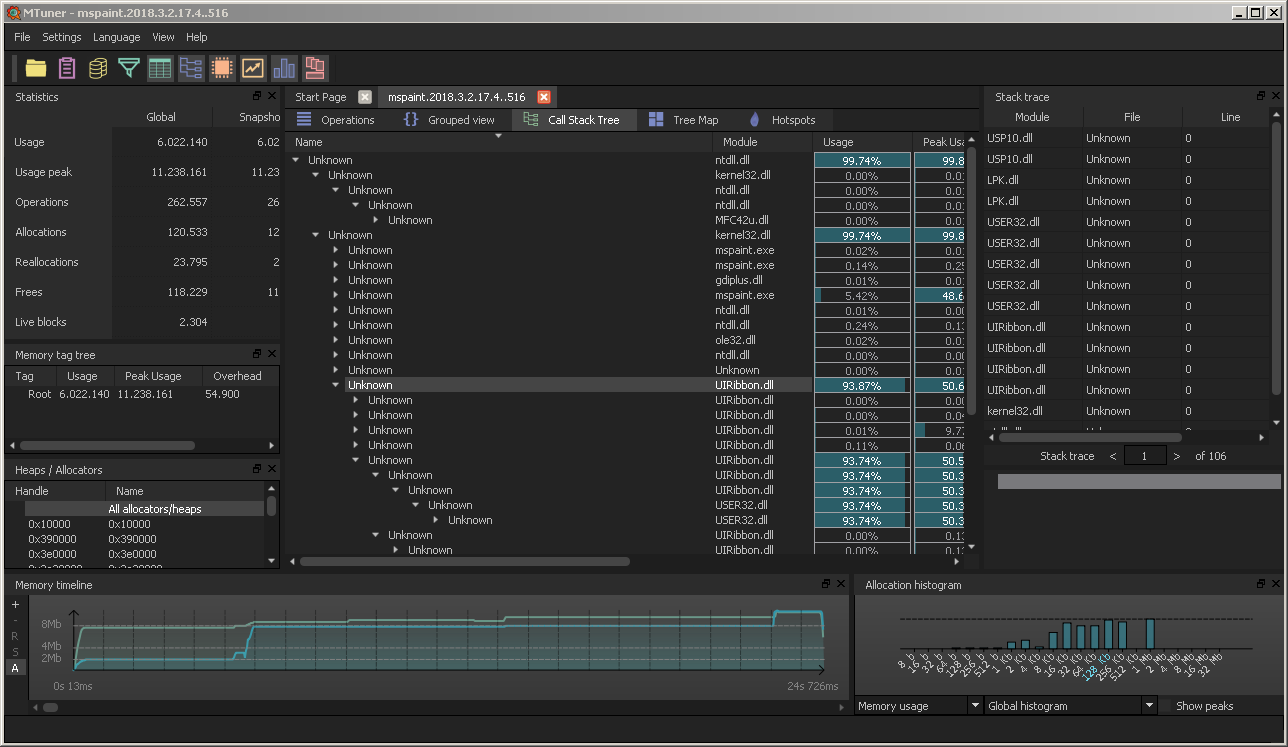
Pro: works out of the box without any reconfiguration of the app;
captures data which can be evaluated later; fancy looking; actively
maintained at github (answers error-reports fast); does not need much
explanation
Con: crashes currently while evaluating the bigger traces (400 MiByte+)
And then one Microsoft tool: UMDH
Con: much trouble to acquire and getting it to work (long explanation)
Pro: but the diff of the allocations as stacktraces can be helpful
0. install windows SDK
1. set the gflags correctly: means allow stacktraces for the process
2. capture two snapshots of current image of the process
C:\Program Files (x86)\Windows Kits\10\Debuggers\x86>umdh.exe -p:8480
-f:c:\alloc0.txt
and some moments/actions later
C:\Program Files (x86)\Windows Kits\10\Debuggers\x86>umdh.exe -p:8480
-f:c:\alloc1.txt
3. compare and get starting line 300-400 some descending view of the
biggest allocation-changes:
C:\Program Files (x86)\Windows Kits\10\Debuggers\x86>umdh.exe -d
c:\alloc0.txt c:\alloc1.txt > c:\alloc_diff10o1.txt
|
1 2 3 4 5 6 7 8 9 10 11 12 13 14 15 16 17 18 19 20 21 22 23 24 25 26 27 |
// Each log entry has the following syntax: // // + BYTES_DELTA (NEW_BYTES - OLD_BYTES) NEW_COUNT allocs BackTrace TRACEID // + COUNT_DELTA (NEW_COUNT - OLD_COUNT) BackTrace TRACEID allocations // ... stack trace ... // // where: // // BYTES_DELTA - increase in bytes between before and after log // NEW_BYTES - bytes in after log // OLD_BYTES - bytes in before log // COUNT_DELTA - increase in allocations between before and after log // NEW_COUNT - number of allocations in after log // OLD_COUNT - number of allocations in before log // TRACEID - decimal index of the stack trace in the trace database // (can be used to search for allocation instances in the original // UMDH logs). // + 66539182 ( 97482032 - 30942850) 1498137 allocs BackTrace181E60 + 954620 ( 1498137 - 543517) BackTrace181E60 allocations ntdll!RtlUlonglongByteSwap+BB9 MSVCR120!malloc+33 MSVCR120!operator new+E [...] |
at *: I know, sometimes it is not a leak, but “by design” 😉
“un-optimize” a VisualStudio-solution
By default after generating the solution from mpc-files for each vcxproj the optimization-level is set to maximum (O2), which can lead to trouble while debugging. Variables not “visible”, content of containers not readable, .. and then you can stop debugging, reset manually the optimization, restart and go to the breakpoint/crash. Which is a total waste of time.
I’ve also found no way to convince the mpc-buildsystem of building un-optimized.
Ok, then we build us a sed-oneliner which replaces in all project-files the line about optimization and run it under cygwin:
|
1 2 3 4 5 6 |
mpetrick@PC180301 /cygdrive/d/Repo $ time find . -name "*.vcxproj" -exec sed -i 's/<Optimization>MaxSpeed<\/Optimization>/<Optimization>Disabled<\/Optimization>/g' {} + real 0m2,240s user 0m0,247s sys 0m0,982s |