VS2015: after start the solution-explorer just shows error-messages ..
Error message:
Exception details:
System.ComponentModel.Composition.ImportCardinalityMismatchException: No exports were found that match the constraint:
ContractName
Delete that folder:
%LocalAppData%\Microsoft\VisualStudio\12.0\ComponentModelCache
Found via SO..
VisualStudio-Addin for Qt
The source for the current downloads: https://download.qt.io/official_releases/vsaddin/ (for MSVC 2013, 2015 and 2017), because I had to (again) search for the installation-files.
netdata for monitoring several (headless) Raspberries
I had netdata already recommended once two years ago, but .. it was quite helpful to track down the issue with the camera on the catcam-raspberry. Yes, of course I could login via SSH or VNC and then manually check if it is still running, or just call “catcam:19999” in the browser.
Install on Raspbian Jessy via:
|
1 |
bash <(curl -Ss https://my-netdata.io/kickstart.sh) |

Catcam upgraded!
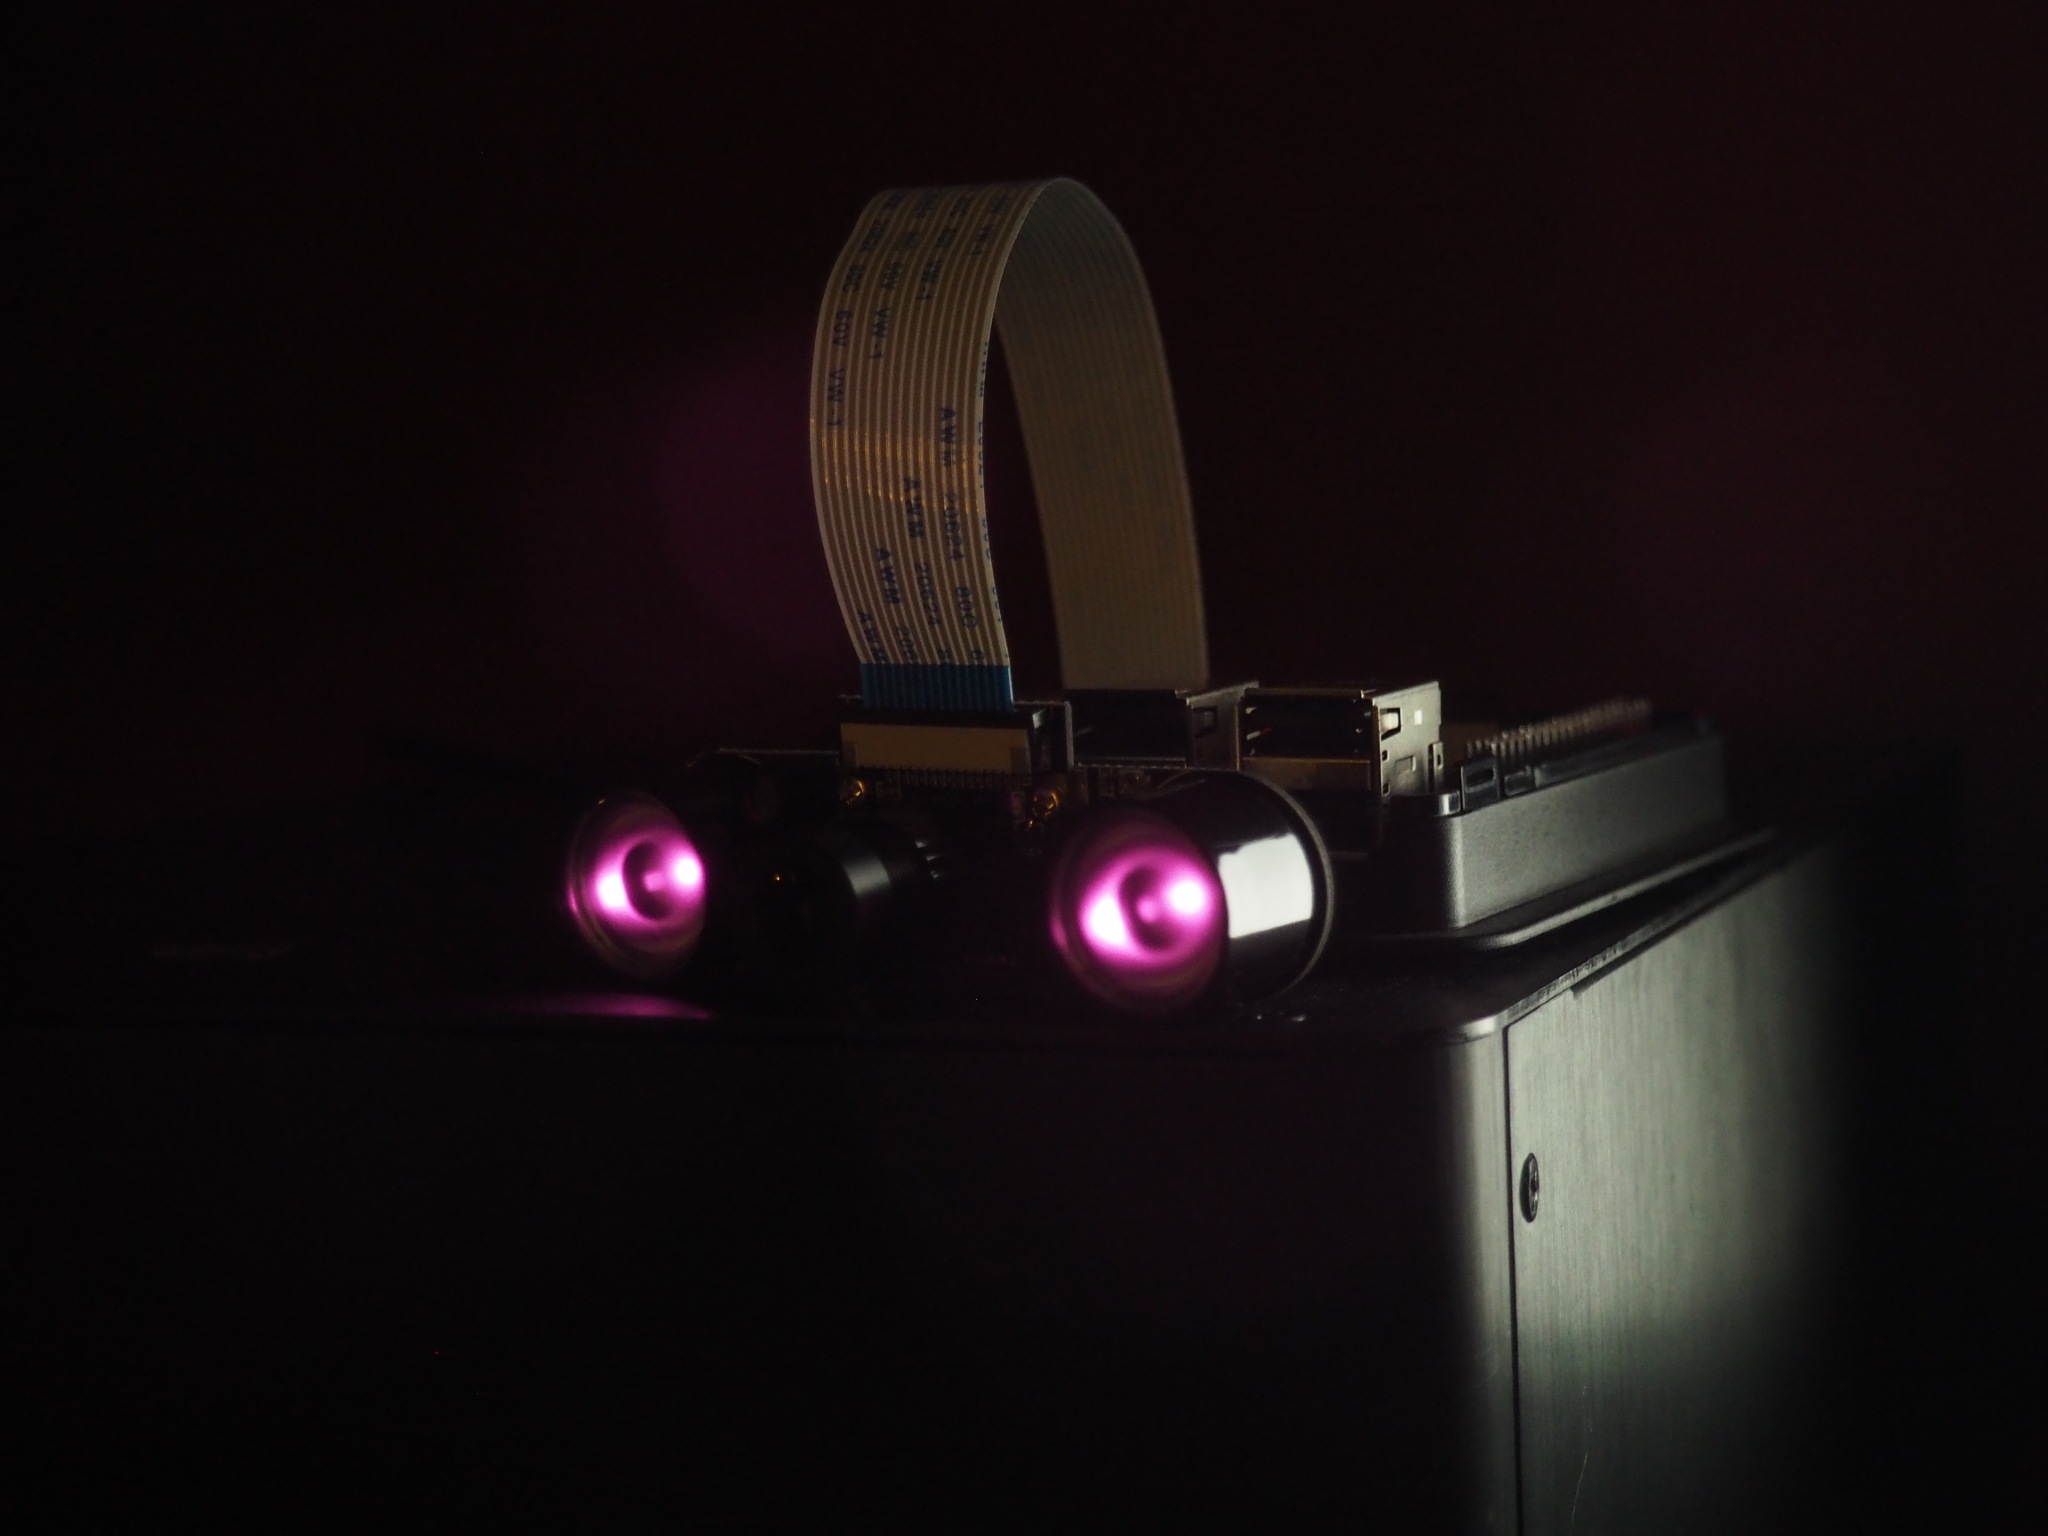
Terminator is watching you!
Finally! The old catcam-setup of a RPi 3 with a NoIR v2.1-camera was working for almost one and ahalf years without any issues. I’ve had improved the PiCamGifForTumblr-script several times, also changed location – never any issues. More than 40.000 GIF were uploaded.
But then I decided to buy a new, fancy case in black (of course) which should add some camera-support. And then two weeks afterwards it stopped working. Sporadically frozen. Sometimes 10 min after start, sometimes during the night. I checked the casing, if all power connectors were tightly fit, I installed netdata on it, I did longterm temperature-measurements (never over 54 °C even with closed case), I ran with minimal setup or with cam attached.
Then it became clearer: the camera was working for singleshot-mode, but for the 30 pictures every ten minutes, it broke. So, it was time to order a new camera, 1080p (5 MPixel) were enough, but for four more Euro I could get two IR-illuminators … so, why not? The focal distance of the objective is adjustable, it looks like it works (long time-test needed). But I am happy. And we can watch cats (and family) in darkness :3

Got myself a micro:bit :)
After gaining some experience with the Calliope mini I was eager to have look over the edge of the plate and found the Sino:bit with an even bigger matrix of 144 LED. BUT: there is still the humble predecessor, the BBC micro:bit. A very original and clever project to get ALL children at school started. At a price of around 17€ what can go wrong? Give ten children one for free and even if just one turns into a programmer/software-developer (or just gains a bit insight how their favorite electronic gadgets work), then it was worth but. But what do I say as german citizen. Hello Flugtaxi :’|
I plan to get my feet into the cold and muddy waters of robotics. Of course, assembling the :move mini with the bulldozer add-on will be nothing great, but I’ve craved to find out how to control a servo and how to put some life into the boring aspects of programming. Just kidding. But blinking LED and measuring values is nice, but … I want to build my own cat-feeder. Or at least something which moves and blinks to keep them a bit attracted.
And: the micro:bit and Calliope mini feature both Bluetooth-radios, so connecting them shouldn’t be a problem.
Another advantage: somehow the given libraries for the micro:bit are more advanced and diverse than the Calliope’s, could be due to the release in 2015 versus 2017. Also: micro:bit features microPython. C not ..
My first idea was to create a stress-test. Play a bit around with the buttons and the “run in background”-feature. Still not heating properly and fast enough.
Code is visible on my micro:bit-repository on github. Just like the one for the Calliope. Suggestions how to make the processing unit glow are heartily accepted 🙂
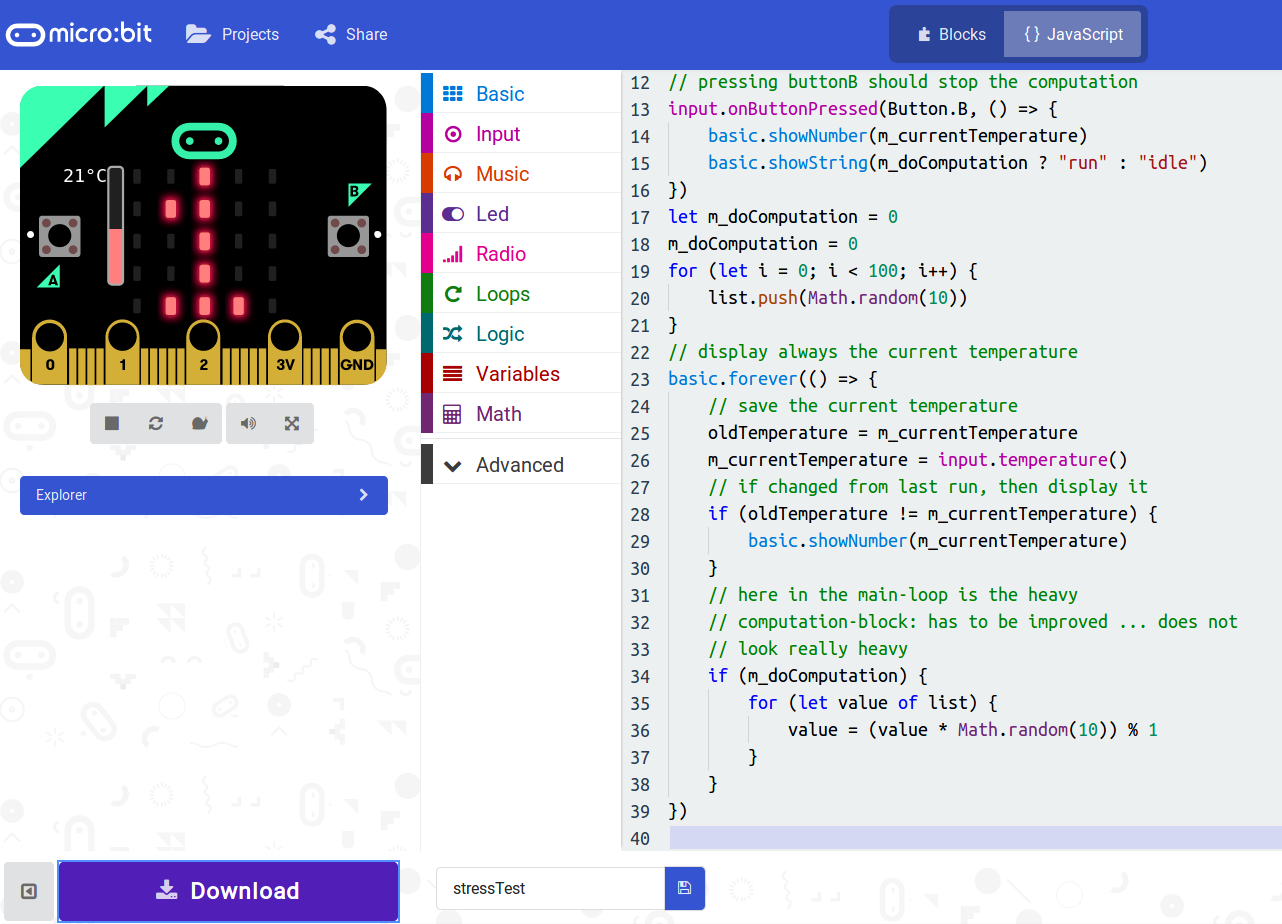
Let us get coding. Somehow I like the enviroment with blocks and the possibility to switch to Javascript. Not my favorite dialect, but … sometimes you have to embrace what is given to you <3
tracking bugs in complex systems ..
Some weeks ago I’ve replaced the case of the ‘catcam’. A Raspberry Pi 3 which was running for 1.5 years without interruption with the nice script & python-upload triggered by a cronjob. And now the device freezes. Still running, but neither accessible via SSH nor VNC (of course, if SSH is not working ..).
I left the case open; removed the camera; upgraded kernel and Raspbian: nothing helped.
My last guess is that the camera stopped working. But to be sure I want to let the RPi3 long-time with temperature-logging. So … we need a simple program:
|
1 2 3 4 5 6 7 8 9 10 |
import os import time def measure_temp(): temp = os.popen("vcgencmd measure_temp").readline() return (temp.replace("temp=","")) while True: print(time.ctime() + " ## " + measure_temp()) time.sleep(1) |
executed like this, because else the output is buffered up to 4 or 8 kByte:
|
1 |
$ stdbuf -oL python temperature.py > worstLoggingEver.txt |
and the content of the textfile is something like:
|
1 2 |
Tue Mar 6 22:52:59 2018 ## 51.5'C Tue Mar 6 22:53:00 2018 ## 52.1'C |
Tracing memory-leaks* under Windows
For a long time I am searching for a useable profiler for windows,
which does not only track the time (like VerySleepy) but memory-usage.
I was used to Instruments under OSX and – boy – I was surprised there
is nothing comparable under Windows.
Visual Studio newer than 2013 is not useable – I know there are profilers integrated.
Dr. Memory crashes at start.
AppVerifier does not work (crash).
http://wiki.qt.io/Profiling_and_Memory_Checking_Tools has some more
hints, but let me present the two tools which finally gave me some
insight:
MTuner (https://github.com/milostosic/MTuner) from Milos Tosic (2017)
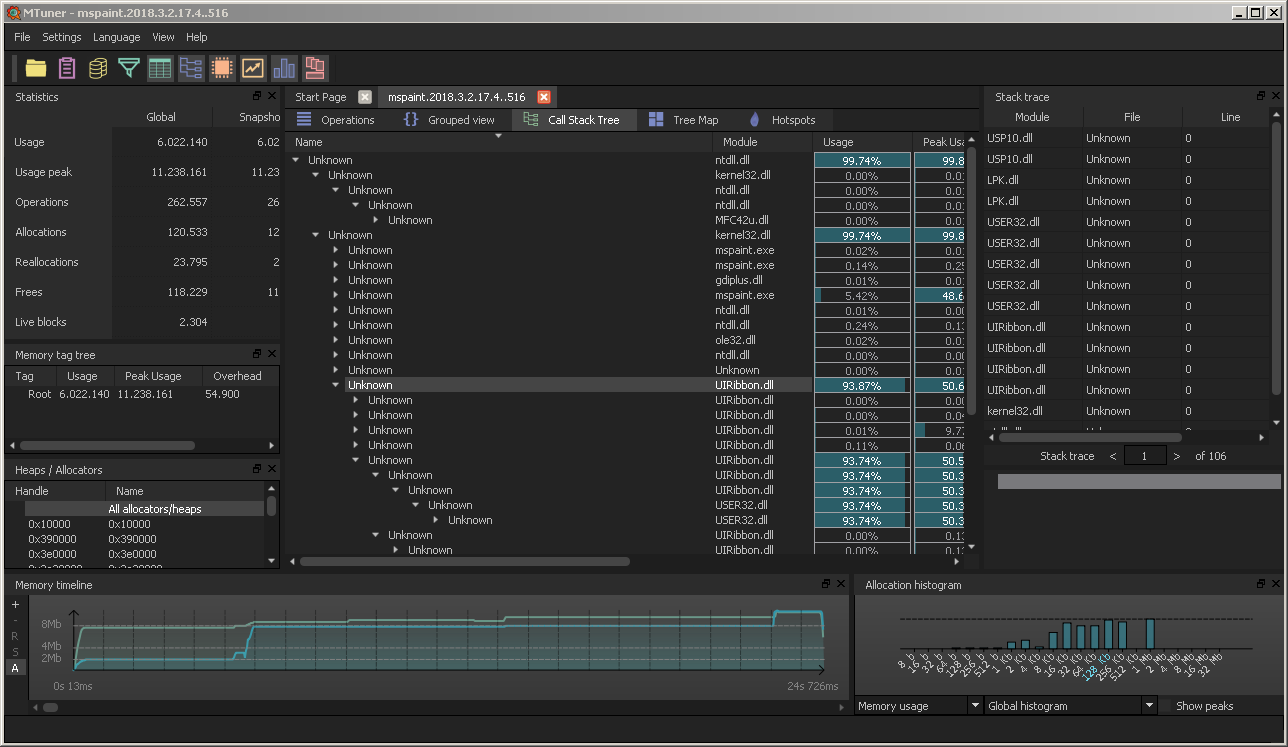
Pro: works out of the box without any reconfiguration of the app;
captures data which can be evaluated later; fancy looking; actively
maintained at github (answers error-reports fast); does not need much
explanation
Con: crashes currently while evaluating the bigger traces (400 MiByte+)
And then one Microsoft tool: UMDH
Con: much trouble to acquire and getting it to work (long explanation)
Pro: but the diff of the allocations as stacktraces can be helpful
0. install windows SDK
1. set the gflags correctly: means allow stacktraces for the process
2. capture two snapshots of current image of the process
C:\Program Files (x86)\Windows Kits\10\Debuggers\x86>umdh.exe -p:8480
-f:c:\alloc0.txt
and some moments/actions later
C:\Program Files (x86)\Windows Kits\10\Debuggers\x86>umdh.exe -p:8480
-f:c:\alloc1.txt
3. compare and get starting line 300-400 some descending view of the
biggest allocation-changes:
C:\Program Files (x86)\Windows Kits\10\Debuggers\x86>umdh.exe -d
c:\alloc0.txt c:\alloc1.txt > c:\alloc_diff10o1.txt
|
1 2 3 4 5 6 7 8 9 10 11 12 13 14 15 16 17 18 19 20 21 22 23 24 25 26 27 |
// Each log entry has the following syntax: // // + BYTES_DELTA (NEW_BYTES - OLD_BYTES) NEW_COUNT allocs BackTrace TRACEID // + COUNT_DELTA (NEW_COUNT - OLD_COUNT) BackTrace TRACEID allocations // ... stack trace ... // // where: // // BYTES_DELTA - increase in bytes between before and after log // NEW_BYTES - bytes in after log // OLD_BYTES - bytes in before log // COUNT_DELTA - increase in allocations between before and after log // NEW_COUNT - number of allocations in after log // OLD_COUNT - number of allocations in before log // TRACEID - decimal index of the stack trace in the trace database // (can be used to search for allocation instances in the original // UMDH logs). // + 66539182 ( 97482032 - 30942850) 1498137 allocs BackTrace181E60 + 954620 ( 1498137 - 543517) BackTrace181E60 allocations ntdll!RtlUlonglongByteSwap+BB9 MSVCR120!malloc+33 MSVCR120!operator new+E [...] |
at *: I know, sometimes it is not a leak, but “by design” 😉
“un-optimize” a VisualStudio-solution
By default after generating the solution from mpc-files for each vcxproj the optimization-level is set to maximum (O2), which can lead to trouble while debugging. Variables not “visible”, content of containers not readable, .. and then you can stop debugging, reset manually the optimization, restart and go to the breakpoint/crash. Which is a total waste of time.
I’ve also found no way to convince the mpc-buildsystem of building un-optimized.
Ok, then we build us a sed-oneliner which replaces in all project-files the line about optimization and run it under cygwin:
|
1 2 3 4 5 6 |
mpetrick@PC180301 /cygdrive/d/Repo $ time find . -name "*.vcxproj" -exec sed -i 's/<Optimization>MaxSpeed<\/Optimization>/<Optimization>Disabled<\/Optimization>/g' {} + real 0m2,240s user 0m0,247s sys 0m0,982s |